National Data
“I feel strongly that the CCSS will change the face of American education. Teachers just need help with the implementation and understanding of the content.”
— ELEMENTARY SCHOOL TEACHER
• This update was fielded in the summer of 2014. At the time, the Common Core State Standards were being implemented in the District of Columbia and 44 states (with Minnesota implementing the CCSS in ELA only). The states not implementing the standards included Alaska, Indiana, Nebraska, South Carolina, Texas and Virginia. All implementation states are included in this research with the exception of Delaware.
• When comparisons are made between the 2013 and 2014 findings across the total sample of teachers answering a question, differences of four or more points are statistically significant at the 95% confidence level. When comparisons are made across subgroups of teachers in the 2014 study, in general, differences of six or more points are needed to claim statistical significance at the 95% or 90% confidence level.
• More on Methodology.
Teachers’ Views on the Common Core State Standards One Year Later
- Primary Sources is a part of an ongoing dialogue with America’s teachers. This update of teachers’ views on the Common Core State Standards, fielded in July 2014, reports the views of more than 1,600 of the same teachers who responded to the Primary Sources, Third Edition study in July 2013 and who teach in the more than 40 states where the standards are being implemented.
- In 2014, teachers are more likely to report feeling prepared to teach to the Common Core (79% in 2014 vs. 71% in 2013); they are also now more likely to say implementation is going well in their schools (68% in 2014 vs. 62% in 2013).
- Fifty-three percent (53%) of teachers overall have seen a positive impact on their students’ ability to think critically and use reasoning skills due to Common Core implementation. Sixty-eight percent (68%) of teachers who report they are in schools where implementation was fully complete in the 2012–13 school year (or earlier) say the same.
- Eighty-four percent (84%) of teachers who have experienced more than one year of full implementation say they are enthusiastic about the implementation of the new standards.
- Fewer teachers overall this year than last say that they are enthusiastic about Common Core implementation (68% in 2014 vs. 73% in 2013); teachers are now also more likely to say implementation is challenging (81% in 2014 vs. 73% in 2013).
- Teachers identify Common Core–aligned instructional materials (86%), quality professional development (84%), additional planning time (78%) and opportunities to collaborate (78%) as critical to ensure successful implementation.
A MAJORITY OF TEACHERS SAY COMMON CORE IMPLEMENTATION IS UNDERWAY AND IS GOING WELL IN THEIR SCHOOL
Implementation of the Common Core State Standards has progressed in classrooms throughout the country, with two-thirds of teachers (65%) saying implementation is mostly (39%) or fully (25%) complete. Last year, fewer than half of teachers (46%) said the same.
Teachers’ Views on Status of Common Core State Standards Implementation
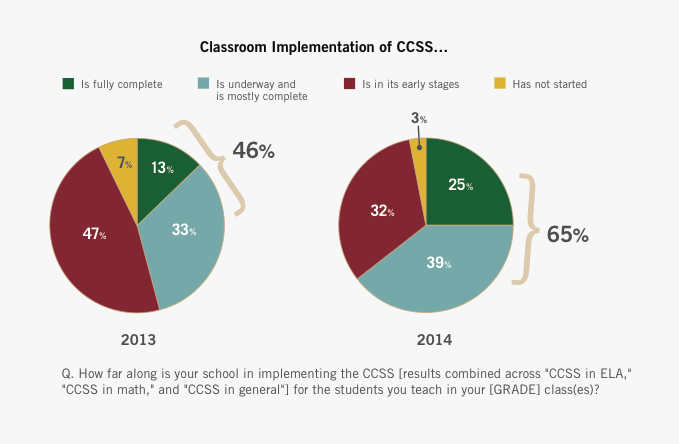
Base: Total Respondents. Details: page 7 in the report PDF.
Like last year’s findings, implementation continues to be further along in elementary schools than in secondary schools. Seventy-six percent (76%) of elementary school teachers say the standards are mostly or fully implemented in math, English language arts (ELA) or in general, compared to 61% of teachers who teach middle school and 47% who teach high school.
A majority of teachers (68%) who say implementation has started in their school agree it is going well, up six points from 2013. As one teacher noted, “I feel that within my district, efforts are being made to help teachers understand and implement the Common Core State Standards, and I feel comfortable and enjoy learning about new ways to do things.” Among teachers who say implementation is mostly or fully complete, this percentage rises to 81%, versus only 38% for teachers in schools where implementation is in its early stages.
Agreement with Statement About Common Core State Standards

Base: Teach ELA, Math, Science and/or Social Studies and Teach in School Where Classroom Implementation Has Started. Details: page 8 in the report PDF.
Teachers feel increasingly prepared to teach to the Common Core
The percentage of teachers who feel “very” or “somewhat” prepared to teach to the Common Core State Standards has grown from 71% in 2013 to 79% in 2014, with a 50% increase in the percentage who feel “very prepared” (up from 20% in 2013 to 31% in 2014).
Degree to Which Teachers Feel Prepared to Teach Common Core State Standards
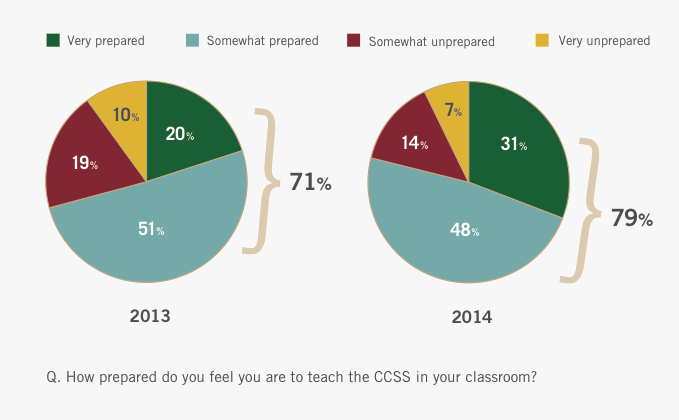
Base: Total Respondents. Details: page 9 in the report PDF.
Half of teachers (52%) also say that their own understanding of what students are expected to learn has changed for the better due to Common Core implementation. Among elementary school teachers, 62% report a positive impact on their own understanding, as do 68% of teachers in schools where implementation is fully complete.
Although teachers’ main sources of information about the Common Core remain professional development (84%), school or district leaders (77%) and colleagues (75%), they are increasingly hearing about the standards from other sources. Notably, 32% now receive information from the news media and 18% from social media (19% and 9%, respectively, in 2013).
Sources of Information About Common Core State Standards
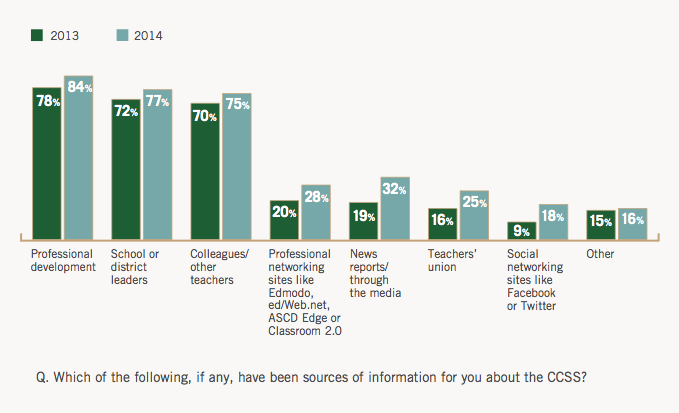
Base: Total Respondents. Details: page 10 in the report PDF.
TEACHERS ARE OPTIMISTIC THAT THE COMMON CORE WILL LEAD TO GREATER LEVELS OF STUDENT ACHIEVEMENT AND MANY ARE ALREADY SEEING POSITIVE CHANGES
When focusing on student outcomes, teachers remain optimistic that the Common Core State Standards will improve:
- students’ ability to think critically and use reasoning skills (74% in 2013, 72% in 2014).
- students’ ability to effectively present their ideas based on evidence (71% in 2013, 70% in 2014).
- students’ ability to read and comprehend informational texts(68% in 2013, 66% in 2014).
To that end, many teachers are already seeing a positive impact on their students’ abilities to:
- think critically and use reasoning skills (53%),
- effectively present their ideas based on evidence (53%),
- read and comprehend informational texts (50%),
- use real-world tools and resources (46%), and
- work collaboratively with peers (46%).
Notably, when looking at teachers across grades taught, teachers’ views on the impact that the Common Core has had on student skills and abilities are the most positive among elementary school teachers. As one elementary teacher shared, “I think that having the students constantly cite evidence has really helped them provide adequate reasoning for their thinking in all subject areas. The students are better understanding the content than before.”
Percentage of Teachers Who Have Seen a Very Positive/Positive Change in Their Students’ Abilities in Each Area as a Result of Implementing Common Core State Standards, by Grade(s) Taught
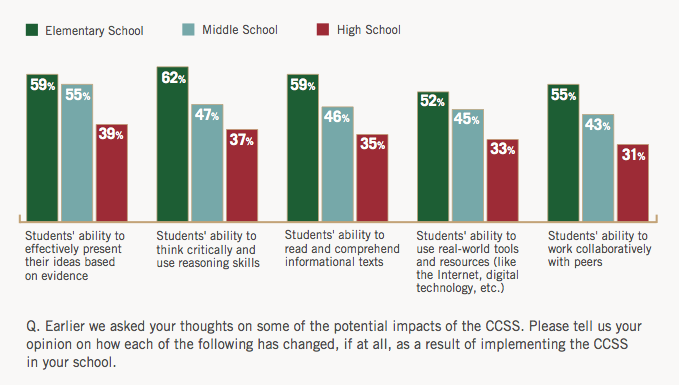
Base: Teach in School Where Classroom Implementation Has Started. Details: page 11 in the report PDF.
When it comes to whether and how the Common Core is affecting student engagement, a majority of teachers (55%) in schools where implementation has started have not observed a change. Among the remaining 45% of these teachers, more often they report a positive effect (27%) on student engagement and enthusiasm in their classrooms than a negative effect (18%). Only half of those who say the Common Core has negatively affected student engagement—8% of teachers overall—feel it is a permanent change.
Similar to other observations, elementary school teachers are more likely than are secondary school teachers to report a positive change in student engagement (38% vs. 19% for middle school and 12% for high school teachers). Further, teachers in schools where implementation is fully complete are more likely to report a positive change (36%) than are teachers in schools where implementation is mostly complete (26%) or is in its early stages (21%).
TEACHERS IN SCHOOLS WHERE IMPLEMENTATION IS WELL UNDERWAY ARE MORE LIKELY TO REPORT SEEING CHANGES IN THEIR STUDENTS’ SKILLS AND ARE ALSO MORE ENTHUSIASTIC ABOUT IMPLEMENTATION
We learned in 2013 that the further along in implementation teachers were in their schools, the more positive their attitudes and experiences were toward the Common Core across a wide range of measures, and in 2014 this remains true.
Teachers in schools where the Common Core is fully implemented are far more likely to say that they are seeing positive changes in their students’ abilities than are teachers who are in the early stages or in schools where implementation is mostly—but not fully—complete.
Percentage of Teachers Who Have Seen a Very Positive/Positive Change in Their Students’ Abilities in Each Area as a Result of Implementing Common Core State Standards, by Stage of Implementation
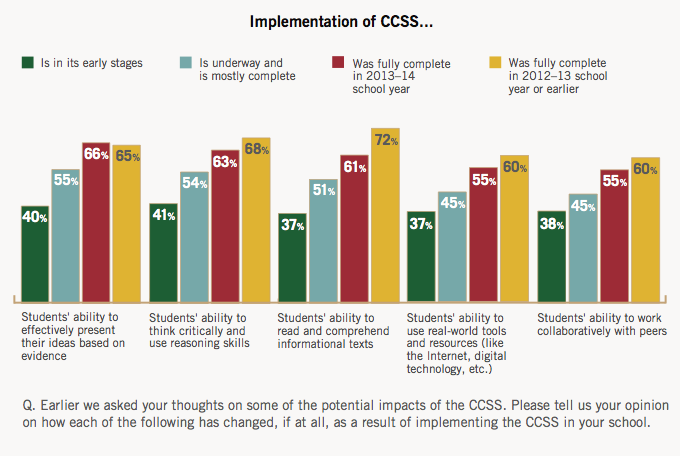
Base: Teach in School Where Classroom Implementation Has Started. Details: page 12 in the report PDF.
Likewise, the most enthusiastic teachers are those who teach in schools where implementation is reported as being fully complete since the 2012–13 school year or earlier. Eighty-four percent (84%) of these teachers—who have essentially experienced more than one year of full implementation of the Common Core—are enthusiastic about implementing the standards in their classrooms. In comparison, 73% of teachers in schools that completed implementation in the 2013–14 school year say the same. Enthusiasm decreases dramatically, to 55%, among teachers in schools where implementation has not yet started or is in its early stages.
Agreement with Statement About Common Core State Standards, by Stage of Implementation
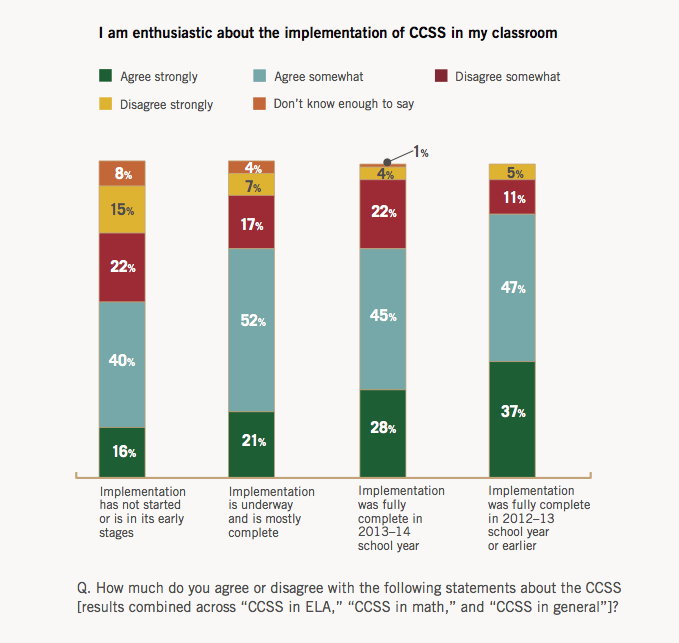
Base: Teach ELA, Math, Science and/or Social Studies. Details: page 13 in the report PDF.
Among all respondents, nearly seven in 10 (68%) agree that they are enthusiastic about implementing the standards in their classrooms. This is lower than last year (73%). As one teacher said, “I know many have mixed emotions and experiences with the Common Core and the new assessments, but I feel this is a much better way of teaching and learning that will be a benefit to all in the long run and hopefully shape students with the ability to think at a deeper level.”
EVEN AS A MAJORITY OF TEACHERS HAVE MAINTAINED ENTHUSIASM FOR THE STANDARDS, THEY CONTINUE TO RECOGNIZE CHALLENGES AND CALL FOR RESOURCES
Just as more teachers report their schools are further along in implementation of the Common Core State Standards this year than last, more teachers feel the work is challenging. Last year, 73% of teachers agreed that implementation is challenging; this year, 81% of teachers agree.
Agreement with Statement About Common Core State Standards
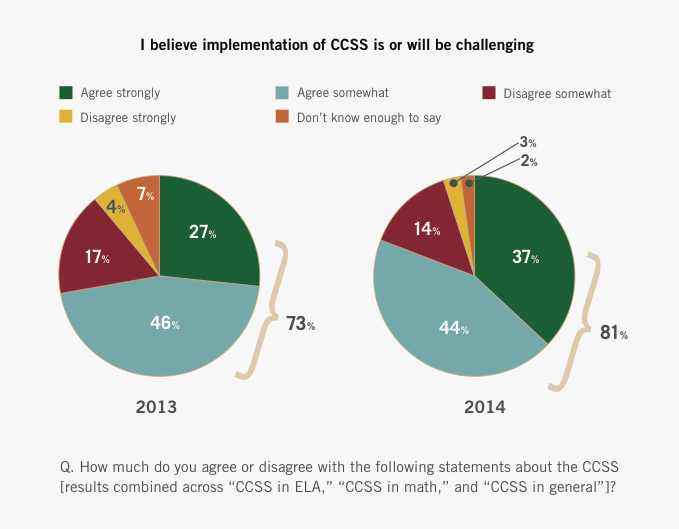
Base: Teach ELA, Math, Science and/or Social Studies. Details: page 14 in the report PDF.
This Primary Sources update also asked teachers to reflect on factors beyond their classrooms that have been problematic for their school system in implementing the Common Core. When provided a list of possible external factors, teachers most often choose student results on new tests factoring into their evaluations (59%) and uncertainty about which assessments their state will use to measure student progress toward the standards (51%) as problematic. Thirty-nine percent (39%) cite uncertainty about whether their state is continuing implementation as problematic. This sentiment is meaningful and likely contributes to the decrease in teachers’ agreement that the standards are here for the long term (67% in 2013 vs. 62% in 2014).
External Factors That Have Been Problematic for School System in Implementing Common Core State Standards
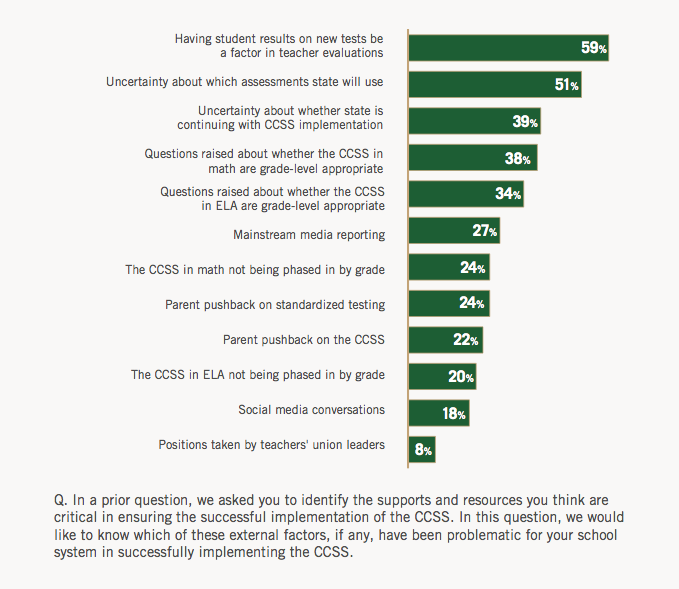
Base: Total Respondents. Details: page 15 in the report PDF.
Teachers continue to identify many critical supports and resources as necessary to ensure successful implementation of the standards. More than eight in 10 teachers who teach ELA, math, science and/or social studies cite CCSS-aligned instructional materials (86%) and quality professional development (84%) as critical. Additional planning time to find materials and prepare lessons, and opportunities to collaborate on best practices follow closely, with 78% of teachers saying each is critical. The fifth most commonly cited need is ways or ideas on how to teach in an inquiry-based way to promote deep thinking among students (69%).
Supports and Resources Teachers Say Are Critical to Ensure the Successful Implementation of Common Core State Standards

Base: Teach ELA, Math, Science and/or Social Studies. Details: page 16 in the report PDF.
Three types of CCSS-aligned instructional materials were asked about in the survey. Teachers say the greatest needs are age-appropriate, leveled materials (74%) and high- interest materials (70%). Additionally, 46% cite a need for aligned digital resources, such as apps, software programs or other digital content. In terms of quality professional development, a majority of teachers cited the three areas of focus asked about as critical. Teachers say professional development focusing on the content of the standards that apply for their students is needed (65%), as well as knowledge of how to embed the Common Core across subject areas (64%) and, to a slightly lesser degree, professional development on the instructional shifts needed to teach the standards (59%). As one high school teacher said, “Teachers have a wide variety of needs in their classroom with limited resources to address the kids and their needs. I want better professional development that will help me be a better teacher in my changing classroom and school.”
Percentage of Teachers Who Say Each is Critical to Ensure the Successful Implementation of Common Core State Standards
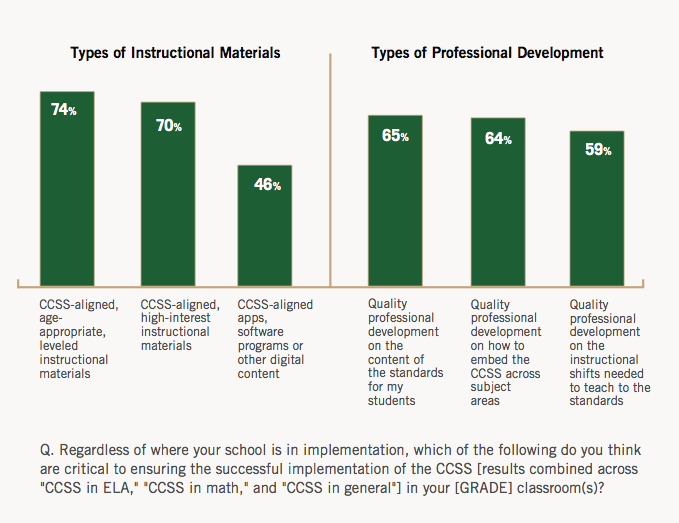
Base: Teach ELA, Math, Science and/or Social Studies. Details: page 17 in the report PDF.
For each support or resource that teachers identified as critical to successful implementation, teachers were then asked if they sought out the item on their own or if they received the item from their school, district and/or state (teachers could choose one, neither or both options). In many cases, a majority of teachers say they sought the item out on their own. In some cases, teachers are far more likely to have sought the item out than to have received it. For example, of the 74% of teachers who said aligned, age-appropriate, leveled instructional materials are critical, 65% sought these types of materials out on their own, and 37% received these from their school, district and/or state.
In other areas, like professional development, a majority of teachers did receive the types of professional learning opportunities they deemed critical from their school, district and/or state. Notably, a significant percentage of teachers also sought out their own professional development.
Ways Teachers Obtained Instructional Materials and Professional Development Experiences
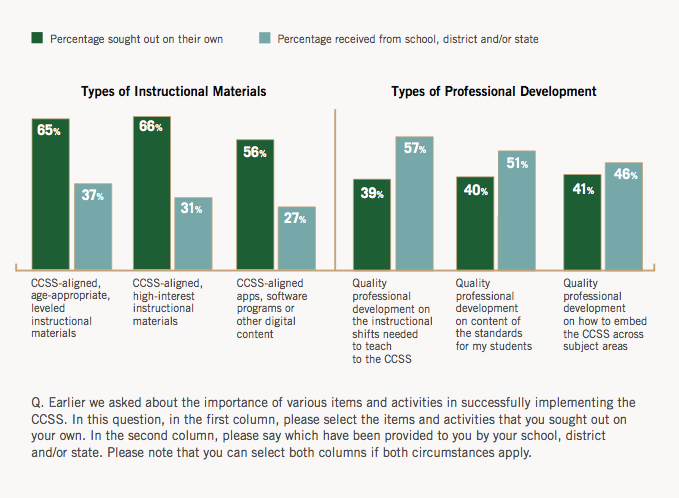
Base: Teach ELA, Math, Science and/or Social Studies. Base Varies According to Whether Teacher Identified Each as Critical to Ensure the Successful Implementation of the CCSS. Details: page 18 in the report PDF.
Across the remaining supports and resources that were asked about in the survey, a majority of teachers who deem an item critical are seeking out the following on their own:
- Ideas on teaching in an inquiry-based way that promotes deep thinking among students (68%).
- Additional planning time to find materials and plan lessons (67%).
- More information on the purpose behind the Common Core (60%).
- Opportunities to collaborate with teachers on best implementation practices (58%).
Ways Teachers Obtained Other Materials and Resources (continued from previous chart)
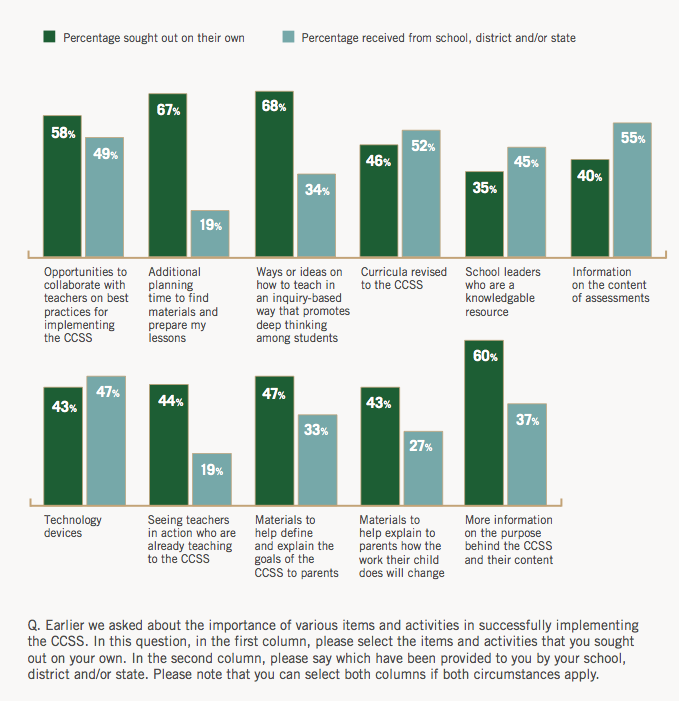
Base: Teach ELA, Math, Science and/or Social Studies. Base Varies According to Whether Teacher Identified Each as Critical to Ensure the Successful Implementation of the CCSS. Details: page 19 in the report PDF.
In addition to the critical needs teachers identify for successful implementation of the standards overall, teachers cite resources needed for special populations in their classrooms. When asked which, if any, student population they were most concerned about meeting the requirements of the standards, roughly the same percentage of teachers as in 2013 report being concerned about students who are currently working two or more grades below grade level (40% in 2013, 42% in 2014) and special needs students (26% in 2013, 27% in 2014). (Note: Percentages are among the 72% and 75% of teachers who have these special populations in their class(es), respectively.)
The needs teachers identify to support these students and other special student populations also remain consistent. Age-appropriate, leveled (43%) and high-interest (38%) instructional materials top the list, followed by in-school staff, including co- teachers (30%), trained classroom paraprofessionals (27%), school leaders committed to providing resources for each population (27%) and in-school specialists (25%).
TEACHERS WHO SAY THE COMMON CORE WILL BE POSITIVE FOR MOST STUDENTS HAVE BEEN MORE INVOLVED WITH PUTTING THE STANDARDS INTO PRACTICE
A majority of teachers (63%) did not change their opinions over the course of the year as to whether the Common Core will be positive for most students, will not make much of a difference or will be negative for most students; teachers remain much more likely to believe the standards will be positive for most students than negative (48% vs. 17%). Overall, slightly less than half of teachers (48%) say the Common Core State Standards will be positive for most students, down from 57% last year. Seventeen percent (17%) say the standards will be negative, up from 8% last year. The percentage of teachers who say the standards will not make much of a difference remains at 35%.
Teachers’ Views on Whether Common Core State Standards Will Be Positive, Negative or Will Not Make Much of a Difference for Most Students
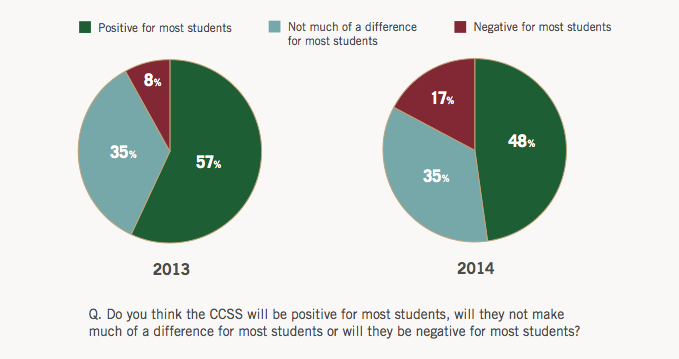
Base: Total Respondents. Details: page 21 in the report PDF.
When teachers who feel the standards will be positive for most students are compared to teachers who feel the standards will be negative for most students, several patterns emerge.
First, teachers who view the standards positively are more likely to say their in-school, Common Core–related experiences were “extremely” or “very” helpful. These experiences include discussing the standards with peers, using aligned materials in class and receiving professional development.
Second, they are more likely to have been personally involved in aspects of curriculum development and instructional materials selection.
Third, they are more likely to have received information about the standards through professional development and less likely to have received information through the media.
Comparison of Select Teacher Views on and Experiences with Common Core State Standards, by Teachers’ Views on Whether CCSS Will Be Positive or Negative for Most Students
Teachers Who Say CCSS Will Be Positive for Most Students |
Teachers Who Say CCSS Will Be Negative for Most Students |
|
Teachers who say CCSS will be positive for |
||
Found discussing the CCSS with their peers extremely/very helpful |
77 |
49 |
Found using CCSS-aligned materials in class extremely/very helpful |
76 |
44 |
Found the professional development they experienced extremely/very helpful |
64 |
29 |
Participated in the review of potential new sources of instructional materials |
51 |
32 |
Participated in aligning current instructional materials to CCSS to identify gaps |
48 |
33 |
Participated in the development of new curricula |
45 |
31 |
Received information about the CCSS through professional development |
90 |
76 |
Teachers who say CCSS will be positive for |
||
Received information through news reports and media |
27 |
44 |
Q. FOR FIRST THREE ITEMS: Thinking about each of the following that you may have participated in or experienced since the start of the 2013–14 school year (that is, last school year through now), how helpful is/was each in preparing you to teach to the CCSS for the grade(s) you teach? Base: Teach ELA, Math, Science and/or Social Studies. Base Varies According to Whether Teacher Experienced Each.
|
||
Details: page 22 in the report PDF.
There are also differing views on the external factors that teachers identify as challenges. Teachers who say the standards will be negative for most students are more likely to cite certain factors as problematic when it comes to successful implementation of the standards. These include having student results on new tests aligned to the standards factor into their evaluations, questions raised about the grade-level appropriateness of the standards and uncertainly about whether their state will be continuing with the implementation of the standards.
Comparison of Teachers’ Views on External Factors That Have Been Problematic for Teacher’s School in Successfully Implementing the Common Core State Standards, by Teachers’ Views on Whether CCSS Will Be Positive or Negative for Most Students
Teachers who say CCSS will be positive for most students are LESS likely to say that the following factors are problematic: |
Teachers Who Say CCSS Will Be Positive for Most Students |
Teachers Who Say CCSS Will Be Negative for Most Students |
Having student results on new tests be a factor in teacher evaluations |
55 |
65 |
Questions raised about whether the CCSS in math are grade-level appropriate |
32 |
58 |
Questions raised about whether the CCSS in ELA are grade-level appropriate |
29 |
52 |
Uncertainty about whether their state will be continuing in the implementation of the standards |
32 |
49 |
Q. In a prior question, we asked you to identify the supports and resources you think are critical in ensuring the successful implementation of the Common Core. In this question, we would like to know which of these external factors, if any, have been problematic for your school system in successfully implementing the Common Core. |
||
Details: page 23 in the report PDF.
IN CONCLUSION, RAISING THE VOICE OF TEACHERS
Reaffirming the need to highlight teachers’ viewpoints on current topics in education, teachers continue to report they do not feel that their voices are being heard beyond their own school. Similar to 2013, while more than two-thirds of teachers (68%) feel the opinions of teachers like them are heard and valued in the decision-making process at their school, this falls to 30% at the district level, 5% at the state level and only 1% at the national level. One in four teachers (27%) feel that the opinions of teachers like them are not heard or valued at any level.
Percentage of Teachers Who Feel the Opinions of “Teachers like me” Are Heard and Valued at Each Level
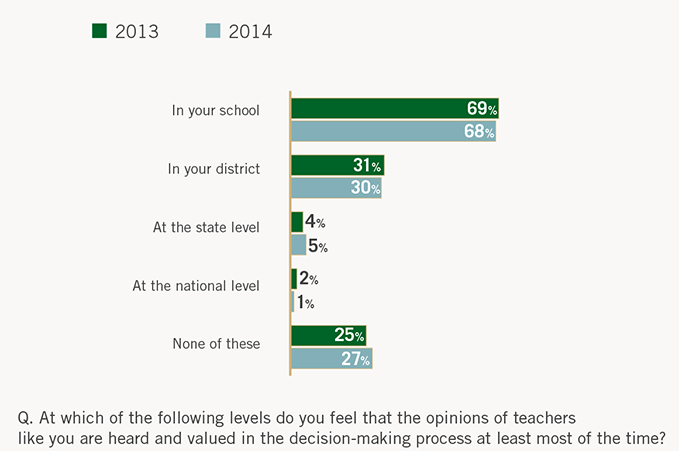
Base: Total Respondents. Details: page 2 in the report PDF.
As we reflect on the full scope of teachers’ perspectives on how the Common Core is impacting their students and classrooms, we see what we have seen in each Primary Sources edition: teachers are committed to providing the best instruction for their students and to guiding them to success—a responsibility at the root of their call for resources and support in this era of change. As one teacher noted, “I feel strongly that the Common Core will change the face of American education. Teachers just need help with the implementation and understanding of the content.”
Primary Sources continues to be one important way that administrators, policy makers and others engaged in the success of our education system can hear and learn from teachers. We hope the viewpoints offered in this report help to foster supportive and collaborative communities so teachers can ensure high-quality learning in the classroom and so all students can achieve their full potential in college and careers.
